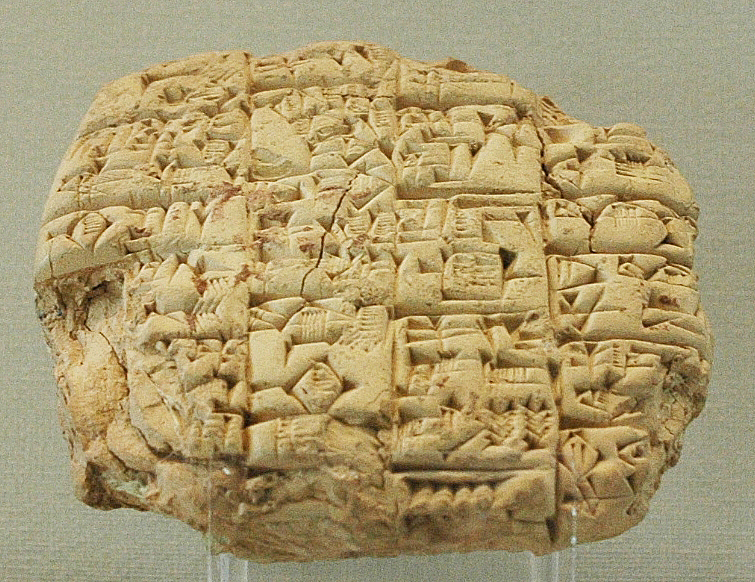
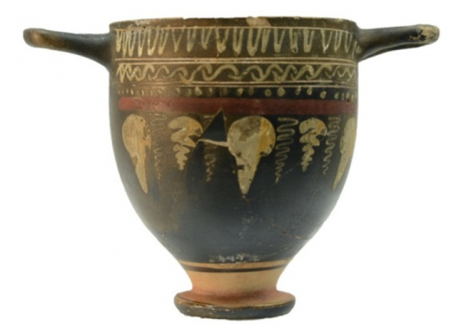
Archaeological Computing Research Group

Digital Boat Recording: the latest technologies 20.05.2013

The University of Southampton Centre for Maritime Archaeology and Archaeological Computing Research Group, with the support of the Southampton Marine and Maritime Institute, are pleased to announce a workshop on ‘Digital Boat Recording: the latest technologies’, that will be held at the University of Southampton, Faculty of Humanities, Lecture Theatre B on May 20th 2013 between 09:30 – 13:15. The event will also be streamed live on this page (see below), and a full schedule is available here

Tweet @ArchCRG or email mjh1g10@soton.ac.uk if there are any problems with viewing the stream. If you would like to ask a question to a speaker during discussion you can also tweet @ArchCRG.

The workshop aims to showcase the latest cutting edge technologies used in the digital recording of 3D boats, amongst other structures and objects. The workshop is designed as a platform for academics developing technologies and software for archaeological recording and ship science engineering, as well as users in museums and in the field, together with designers and industry developers to discuss the latest applications (particularly laser scanning and photogrammetry). The workshop will explore some of the challenges of recording such large, enclosed objects often in far from controlled conditions, it will address appropriate methodologies for appropriate conditions and levels of expertise, and discuss ways in which we can improve these techniques to the advantage of the users.

Southampton at the SAA Annual Meeting, Honolulu 3-7 April 2013

Philip RirisApril 23, 2013
by Philip Riris

Recently, the department of archaeology at Southampton made its debut appearance at the Society for American Archaeology annual conference. This year it was due to be held in Honolulu, Hawai’i, which promised to make it one of the best-attended meetings of its kind. Besides the well-publicized size of the SAA meetings and the high esteem in which they are held, Honolulu is a desirable travel destination for very obvious reasons.

Bearing this in mind, maintaining a stall in the exhibition that runs in parallel to the paper sessions struck me as an excellent opportunity for the department, and the university, to market itself as an interesting and innovative institution at which to pursue postgraduate study.

The Southampton exhibit at SAA 2013

To this end, myself and fellow PhD students Tom Brughmans (both Archaeology) and Iza Romanowska (ICSS), with the financial support of the department and the Faculty of Humanities, hired a booth and positioned ourselves to meet and introduce potential new students to the wide range of programs that Southampton offers during the five days of the conference.

Read the rest of this entry →

Testing a Prototype 3D Structure Light Imaging System for Underwater Archaeology

Peter CampbellApril 23, 2013
by Peter Campbell

Anchor Scanning

While 3D imaging has become a revolution in land archaeology, it has experienced a difficult baptism underwater. Electrical equipment and water do not mix, plus many systems do not easily transfer underwater when you add currents, visibility issues, and salt into the equation. Approaches that have been attempted include acoustics, laser-based systems, and photogrammetry with each of these having varying success depending on site conditions. A new promising system is an underwater structured light system designed by a group of engineers from University of Kentucky and TrioVerse. Structured light systems have a high degree of accuracy, but usually require a stable projector and camera, as well as an on site computer. As I mentioned in my previous blog post, structured light works through projecting a pattern onto a surface, much like sunlight coming through Venetian blinds and bending over furniture. These bends are captured by a camera and the difference between the photograph and the original pattern is calculated by the computer to create a 3D model. This is not the kind of system that would seem practical 30 metres below an active Mediterranean harbour or inside an underwater cave. However, Dr Larry Hassebrook and Eli Crane have developed a novel system from working with archaeologist Dr Chris Begley (Transylvania University). Chris works in remote jungle locations along the Mosquito Coast that are hardly conducive to electronics. To suit this extreme environment Larry and Eli completely rethought structure light systems and built an essentials-only scanner that allowed all the processing to be done upon returning from home from the field. After several successful trips into the jungle with this minimal complexity scanner, Larry, Eli and Chris turned their thoughts toward building an even more compact version that was watertight for use on underwater sites.

Chris Begley

Larry and Eli showed me the eight-pound prototype while on a project scannning Bronze Age mortuary caves that Chris and I were co-directing with the Ecomuseu Cap de Cavalleria in Spain. Lightweight and easy to manipulate, the system can be operated by a single diver. The scanner has the same limitation as other structured light systems, namely it required darkness for the projected pattern to appear; however, the engineers found that underwater this less of a problem the deeper you go. Over two weeks of diving, we tested the scanner in several conditions, including in daylight at various depths, during night dives, and in the darkness of the cave system. A wide range of artefacts were scanned including ancient and modern anchors, amphoras, a sarcophagus, and even geological formations like stalagmites and stalactites. The system is still in development, but the prototype’s results are very promising. Take, for example, the photographs and model of the amphora. The 3D data shows the distinct shape of the amphora, which is distinguishable from the background environment. The model does have spatial division modulation noise, but this noise can be corrected through a calibration algorithm in the future. Like all camera-based systems, it require moderate to good visibility, but it will offer a higher degree of accuracy than photogrammetry systems. With only a little training, a team of divers could survey a coastline while recording finds in 3D. The system allows for repeated use over many dives while only using AA batteries and a standard memory card. Cheap and easy to use, this systems holds great potential for underwater archaeology. If you are interested in 3D underwater imaging then be sure to check for updates at www.TrioVerse.com.


Capturing and exploring textures in National Archive

Hembo PagiApril 23, 2013
by Hembo Pagi

BT 43/57/71976: Straw hat, registered on 18 September 1850; proprietor unknown

Some time ago we made a visit to UK National Archive with James Miles to test RTI technology on a wide range of examples provided by the National Archive. James went back in September of 2012 for a second time to do more recording. Recently Dinah Eastop, a Curatorial Research Fellow from the National Archives has written two blog posts and presented the results of the work on their blog. Check it out!

Read more:

The voice of Easter Island in the British Museum

James MilesApril 10, 2013
by James Miles

Over the past year myself, Hembo Pagi and Graeme Earl from the ACRG have been working with Mike Pitts, editor of the British Archaeology Journal, on the Hoa Hakananai’a statue at the British Museum. The work included the production of a virtual model, through photogrammetry and a series of Reflectance Transformation Images to study the petroglyphs found on the statue. The analysis of this work is ongoing but we are happy to announce that an article entitled “The story of Hoa Hakananai’a” appeared in British Archaeology issue 130 pages 24 -31.

You can view the article online at British Archaeology Magazine website with some of the results found below. Research papers are currently in preparation for peer review of the completed work and an introduction to the project was given by myself at the Computer Applications and Quantitative Method in Archaeology 2013 conference in Perth, Australia.

More about the article on Mike Pitt’s Blog

Read the rest of this entry →

#CAAPerth Day Four

March 28, 2013
by Graeme Earl

<Live blog>

11:38

Interesting to get statistics on usage in the field next season – can get at issues then of serendipitous discovery perhaps. Also discussion of potential impact (good and bad) on evolving archaeology on the site of accessing information before it has been in some way checked or otherwise curated. Also is the immediacy of connection between the field and the spceialists. This relates to ongoing work on fieldwork ethnographies as part of the RCUK Patina Project. Also are there plans for linking in these data to publication.

11:35

11:30

Q&A: The advantage of paper is that you can see the changes. You can see all the edit history for all records.

11:28

After three seasons of paperless archaeology at Pompeii communiciation and data access between the people working in all roles at the site and beyond has markedly improved. These benefits far outweigh the issues. More info on Cincinnati blog.

11:27

More information relating to this work is available from the Paperless Archaeology blog.

11:25

Clear benefits in terms of transparency, data management, inventory control and awareness as a consequence of the use of ipad tablets.

11:19

Relevant papers from CAA2012: http://caaconference2012.sched.org/event/8ea5baae496798dde273f5b8deaa75e1?iframe=yes&w=990&sidebar=yes&bg=no#?iframe=yes&w=990&sidebar=yes&bg=no http://caaconference2012.sched.org/event/b054e5104b6d2e305b965791cc0770f9?iframe=yes&w=990&sidebar=yes&bg=no#?iframe=yes&w=990&sidebar=yes&bg=no http://caaconference2012.sched.org/event/9d1ac527a4d73a3e9aacafddf59fd26f?iframe=yes&w=990&sidebar=yes&bg=no#?iframe=yes&w=990&sidebar=yes&bg=no http://caaconference2012.sched.org/event/c4600f5bbd494e01f5fcc039dd469ce3?iframe=yes&w=990&sidebar=yes&bg=no#?iframe=yes&w=990&sidebar=yes&bg=no 11:16

11:08

Greg is reading his notes on use of ipads at Pompeii from his ipad.

11:06

Now in Greg Tucker’s paper: Beyond Tablet Computers as a Tool for Data Collection: Three Seasons of Processing and Curating Digital Data in a Paperless World

10:45

3D PDFs, web models, full resolution obj files etc., all also with locational information in 3D and cartographically. 10:33 You can view thumbnails of multiple obejcts returned by a query or dragged onto the workspace. You can also move the virtual light source over the object interactively. Also zoomable and downloadable high resolution data.

10:31

System allows simple creation of 3D PDF from scan data for download. You can access all the source scripts for free: http://anthropologylabs.umn.edu/digital/webTech.html

10:27

Link to the Minnesota digital lab. Describing google doc as the basis for the content management system, and the use of WebGL and HTML5. The Digital Media library based on these data is onlineExample site on rock art scanning.

10:22

Now speaking Kristy Golubiewski-Davis: Engaging with 3D models beyond specialized software

10:20

Next steps for the Williamsburg Models: AR app, iOS Unity app and integration in their RevQUest alternate reality game series.

10:15

Lisa navigating the models live and providing the narration works really well. Reminded of Daniel Pletinckx’s RadioPast workshop presentation referring to the value of this in the context of V-must findings.

10:14

Next stage is linking exterior and interior models, and linking the models to the underlying data.

10:10

Modelled Williamsburg allows the representation of the town in particular periods. Lisa is now showing the Unity model in a live demo. (Also stumbled across this http://www.eduweb.com/portfolio-betwixt.html)

10:00

Next up Lisa Fischer: Exploring Williamsburg Virtually: Developing an Interactive Model of Williamsburg’s Revolutionary City Neighborhood in 1776

9:58

Q&A suggested that more specific analysis of the types of software and the data created in 3d modelling in archaeology would be beneficial.

9:56

More detail and less interoperability – limited practical implementations of standards despite acceptance of their relevance. For example, London Charter applications only cited in 5 or 6 publications surveyed. Networks of practice (whether naturally developing or funded) are increasingly important.

9:53

In terms of trends there is a focus around large EU funding schemes. There is fast adoption of new technologies (to be expected in this context) and increasing relevance of social media. In terms of presentation there are clear trends in showing research process vs. realistic impression, and in providing more immersive, lively representations.

9:51

Graph analysis of common authorship, and also institutions. Several clusters with strong linkages.

9:48

Bibliometric, graph analysis, qualitiative content analysis of 3d pubs: Authors: Italy top country + Computing top discipline. Archaeology of Italy is most studied in these papers.

9:30

9:26

9:14

9:05


8:57


8:45


8:35

#CAAPerth Day Three

March 27, 2013
by Graeme Earl

I am jumping between sessions today.

<live blog>

10:46

Off to chair session S30 – Computational approaches towards artefacts studies (on behalf of Eleni Kotoula). Session starting at 11:00.

10:45

Examining spatial relationships along the street front.

10:42

Explored overlapping isovists to explore movement around the city, and visual overlaps in order to create visibility connections. <@tombrughmans work on analysis of visibility networks that was presented downstairs would be of interest here.

10:35

Recent laser scanning of site will further add to the possibilities of revisiting the site and also analysing its buildings. Now introducing Scalar Space Syntax – examining networks of connectivity in individual houses, an urban neighbourhood, and the whole street network.

10:33

Very little record survives of the 1938 – 1942 excavation and reconstruction of Ostia. This makes analysis hard. Interesting history of development of mapping. Originally focused on isolated, important buildings. Wider environment only considered later – in aprt tied to technological advances and opportunities e.g. vertical photographs from 1940s. 1990s first map of wider Ostial environment – the DAI.

10:27

Next up  H.Stöger – Roman Ostia: interpretation and understanding: what to do with nice maps? (Note: CAA 2013 programme is here).

10:25

Learn more at http://www.unicaen.fr/cireve/rome/index.php

10:22

Moved to S14 – Beyond Virtual Reality: documentation, interpretation and understanding of ancient cities. Paper by P. Fleury on A Roman Street at the Time of Constantine : Interactive Visit with Access to Ancient Source Materials. Emphasising need for authentication and transparency.

10:16

Transport networks do not seem to explain visibility networks. Sites with origins ion the Iron Age do not seem to act as hubs but visual control being significant. It seems that sites were taken out of the equation that sued to be hubs in the Iron Age. Ends by demonstrating need to address assumptions in detail in network analyses, and that robust techniques such as ERGMs help with this.

10:12

Summary: there is a clear difference between the Iberian and Roman networks. The networks of visibility fragment over time. Long distance decrease but local visibility increases. Sites with urban status tend to be less prominent. ERGM results – 50 million random networks generated per observed network. 1000 samples. These are very different from the observed ones – to be expected because site location is complex, and clearly non-random. For all periods reciprocity is significant and positive – propensity for inter-visibility. Significant all-in-star effect in Iberian, Republican and Early Imperial periods i.e. the visibility of a given site from others. Outgoing links (all-out-stars) also significant.

10:05

Probability viewsheds allow us to generate probability networks. Global measures of these networks – numbe rof nodes, arcs, clustering coefficient, average degree, connected components etc.. Tom will then look at all the components of the network and then generate random networks and compare them to each other – Exponential Random Graph Models (ERGMs). The random networks can include a hypothesis i.e. where a certain configuration is more likely e.g. more visible. Tom uses the analogy of a box of lego – you have the pieces but you have lost the instructions for a particular model. You keep putting the blocks together randomly. It is unlikely that you will end up with the planned model. But what if you start the process knowing that you want to end up with a particular building – the chance is much larger that you will end up with the hypothesised model based on dependent assumptions. This gives a sense of the processes that may have led to the observed distribution.

10:00

Discussing visibility analysis and the chronology, and also the attributes of each site e.g. urban status, road and river networks, etc. What can we do with these data? We can produce probability viewsheds, in this case via 100 binary viewsheds with random error in DEM.

9:57

Tom is interested in the processes that make these visibility patterns emerge. First endogenous processes e.g. extreme case where visibility is the only factor in site location (this is clearly not realistic but required to critique assumptions) and second exogenous processes – the influence of other site characteristics.

9:56

Tom introducing the AHRC Urban Connectivity Project from which his data derive. 195 sites from Iberian to Late Imperial period in the study area in Baetica, southern Spain. Examing the formal metrics of visibility and also the ones gathered on each site, (and hence taking more account of subjective factors and issues of weather etc.). Limited emphasis on intervisibility in the Roman research in the region – much more on networks of connectivity (roads and rivers) and also questions of urban status, hierarchy etc. In the Iberian period intervisibility (e.g. between lookout points) has been considered. Given the continuity of occupation visibility in the Roman period seems to be a useful focus of study.

9:52

@tombrughmans introducing his talk and emphasising how we go from exploratory to confirmatory techniques – dealing with the lack of neutrality and the dynamism of the interpretations and the data underlying them.

9:49

Moved through to S9 – Complex systems simulation in archaeology. Watching a paper by Tom Brughmans: When exploratory network analysis becomes confirmatory: exploring urban connectivity in Iron Age and Roman Southern Spain

9:40

Final case study is Tewkesbury. Using structural analysis to simulate buildings (Abbey Mill and 1 Mill Bank) based on AutoCAD building surveys. Using finite element analysis using Autodesk Simulation (formerly ALGOR). This takes account of material properties such as compressive strength. Example results – 1 Mill Bank can see displacement of localised areas. Ongoing work includes further FEM, thin sectioning of bricks and studying fabric of earth buldings.

9:37

Second case study is Odda’s Chapel at Deerhurst. There has been installation of remote climate modelling instruments here e.g. temperature, relative humidity, wind direction and wind speed. These data are captured and available in real time. Again photogrammetry and ERT have been used to examine absorption, in the context of the continuous weather readings. Also tried using the ERT on a horizontal plane – this was able to show the different material properties and their variable absorption rates.

9:34

Also undertaking photogrammetry as a means to monitor errosion of buildings over the study period. James introducing one of the case studies – Winchester Cathedral crypt. This floods every year. The photogrammetry has been used to check volumetric record of the building, as a means to contextualise the ERT results. Need to do more work comparing the ERT data to the lab tests conducted under control conditions by the project.

9:30

Parnassus Project has included a stone testing programme – testing absorption rate for stone such as Cotswold Stanway Stone and Wadhurst Stone. Also using Electrical Resistance Tomography to record water ingress and absorption in surviving stone buildings. Using up to 64 probes. The Southampton method has been non-destructive i.e. no drilling of holes – instead a medical paste is used to attach the probes.

9:27

James introduces simulation and analysis of wind driven rain impact on building materials. The Parnassus Project website has further details. Now discussing compressive strength of simulated medieval building materials and structural models.

9:23

In S12 – Three-dimensional computational analysis and simulation in archaeological research. @james_e_miles is talking about The Parnassus Project: Archaeology and Engineering collaboration for 3D data collection and analysis

#CAAPerth Day Two – afternoon sessions

March 26, 2013
by Graeme Earl

I am in a few sessions this afternoon.

First:

Is there time for archaeology? Understanding time through modelling and representation
Chair(s): Xavier Rodier, Lahouari Kaddouri

Format: Long Paper Presentation

Schedule: Tuesday 26th 13:30 – 15:00

Room: Seminar Room 2

Venue: University of Western Australia Club

Second:

E pluribus unum – Connecting People, Connecting Data

Chair(s): Guus Lange, Matthias Lang

Format: Long Paper Presentation

Schedule: Tuesday 26th 10:30 – 15:00

Room: Case Study Room

Venue: University of Western Australia Club

<live blog>

14:44

Guus discussing work at his institution on PCA applied to undertake automatic ceramic assemblage classifications.

14:42


14:40

Guus’ example of term variation and disambiguation reminded me of the @sotonDH SAMTLA talk from a few weeks ago. This discussed a tool that enabled exactly the form of multiple-term searching. Watch the SAMTLA seminar video here.

14:31

Guus Lange talking now: Beyond metadata; computing archaeological knowledge

14:29

Q&A: mentioned Sebastian Heath‘s nomisma project as an example.

14:23

Holly discussing a University of Southampton resource held on the ADS: Roman Amphora a Digital Resource. This resource has had 370,000 page views this year. Users stay for extended periods on many parts. It is by far the most used resource the ADS hold. There are twice as much as our entire Grey Literature Library (18,000 fieldwork reports).

In Holly’s work she has tried to map this dataset several times, due to the complexity of the process and the many possibilities. @leifuss suggested that it should be aligned to locational data for example. Reminded also of this tweet and the surrounding discussion #caauk:


Holly found that even stripping out skos:related it was too complicated. She decided it was  better to create a variety of classifications – need to take the literals (skos:altlabel) and create an RDF node.

Big questions:

  • If we start creating nodes for other people’s data this goes beyond our remit
  • Is it better to be useful or preserve the depositors intellectual process, reflected in the archive

Future work:

Use SKOS thesauri as a base. Using open annotation data model and ontology. Get involved more in SENESCHAL and ARIADNE.

14:15

Update from other session:


14:09

GeoNames, DBpedia, Library of Congress, NERC and Ordnance Survey are examples of Linked Data repositories used by the Archaeology Data Service.

14:04

Holly introducing Linked Data work at York. More info on this from the @ArchCRG seminar by Michael Charno available as a video here.

14:01

Moved room. Holly Wright about to start.

13:54

Q&A: Can you quantify uncertainty within this model? Yes but not implemented becuase of lack of agreement over how to ascribe uncertainty values (ironic!). I also asked about whether a provenance framework e.g. PROV had been mapped to this work. The answer is not yet but interest in it.


13:50

Benefits of employing an object-oriented data structure? CHARM provides the abstract reference model. Formal support: mark temporal features, allow for phases, capture ontic change, good to represent objectivised knowledge e.g. building materials. Representation of ubjective features allows for varying perspectives, captures epistemic change, represents interpretative knowledge.

13:45

We can use object slices – slices of the data object created over time and varying subjectivities, with each linked to the originator of this slice e.g. the name of a person who published an interpretation. Can then use diachronic composition to enable complex entities to be built from simpler ones e.g. Hall + Narthex = Church of Santa Olalla; subsequently elements added and these can also be represented. Because of the use of a conventional object representation we can reuse formal support for navigating object data structures.

13:40

Problem of hegemonic and static representations of the world in digital data structures. Using as an example a 19th C Galician church built on top of a crypt. Varying interpretations – Roman nymphaeum, Roman sanctuary to Cybele, Roman funerary place, Proto-Christian temple, Catholic temple, and deconsecrated monument. Alongside these interpretations lie a conventional phased timeline associated with the material remains and their transformation. How capture this complexity?

13:35

First up Expressing Temporal and Subjective Information about Archaeological Entities presented by C.Gonzalez-Perez

#CAAPerth Day Two – S1 – 3D recording, data capture and visualisation technologies for Rock Art

March 26, 2013
by Graeme Earl

Chair(s): Geoff Avern, Jo McDonald

Discussant(s): Geoff Avern, Jo McDonald

Format: Long Paper Presentation with Roundtable

Schedule: Tuesday 26th 10:30 – 15:00

Room: Auditorium

Venue: University of Western Australia Club

Details from: http://caa2013.org/drupal/sessions

<live blog below>

12:35

Finished for lunch.

12:30

Q&A: noting that more data is not necessarily a good thing. You can end up with problems due to multiple errors. Also noting benefits of using targets for automated registration and hence improved accuracy. Again, back to the specific research questions. These also have an impact on data management. A: I would prefer a system where I had control over the stitching, registration and so on and where it was well documented, and transparent. (Reminded here of CHI work on RTI and empirical provenance and the digital lab notebook)

12:24

Quality measures of 3d data capture – accuracy of data points (range/ coordinate and colour), density of data points and coverage/ continuity of data e.g. influence of blind spots. So think carefully why we are recording? Is it a quick grab (of morphology)? Creating a replica? Is it a reference model i.e. aiming for best accuracy in all domains?

Anything working from a fixed position will have blind spots. Also the angle of incidence impacts accuracy so a single position does not allow this to be minimised. Colour data will vary, in addition to range data.

Also problem of laser scanners defining edges accurately.

12:19

Geoff Avern’s second mini-paper of the day – “What Information Are We Capturing? And What Are We NOT?”

12:12

Optical tracking systems and self-localising scanners e.g. NDI and Handy Scan. Also talking about structured light, and possible combination of this with triangulation beacons. Also talking about structure/shape form moton e.g. bundler, 123D, MicMac, Fit3D. Also Xapt – a CMOS camera – array of 16 creating a 3000 x 3000 pixels 50 frames per second. Suggesting mounting these on a drone for surveying rock art.

12:09

Geoff Avern talking now – “The Other” 3D Recording Technologies. Discussing laser scanning and photometric stereo and other photographic tools.

12:07

Follow up on my tweet about the 3d print.


12:01

Q&A: what option do Mirarr people have to edit and annotate? They have embraced it. Particularly the people who have been involved in the field. They want to bring in sacred sites information, walking routes through country, add video links about routes, schools getting more interested, etc.

11:59

Q&A: How deal with finding more image details afterwards, particularly given lots of superimposition? They find that they find most in the field – each image is individually recorded. DStretch is then used later and some additional ones found.

11:58

More details about the project on the Mirarr rock art website.

11:55

Very important to work out a system that allowed the Mirarr to have continuous, almost live action to the data as recorded. 251 sites recorded so far. First level was the basic record, second level more detailed, and third level very detailed recording. 8 days to record one site with 8068 surviving paintings.

11:50

Not sufficient detail from ipads – good for overview. Detail recording via DSLRs. Synchronised time stamps across the data. The system then used the synchronisation to combine the data on a secure online interface.

11:42

Collaboration with Environmental Systems Solutions

11:40

Aim to set up a world class rock art recording programme. Combining academic rock art experts with traditional owners, producing a catalogue, undertaking research – research aims landscape, people and environment, sequence, style and identity, heritage management and conservation.

Created a cultural data management system, undertooks survey and developed custom recording forms, looked at synchronising digital capture devices.


11:38

Mirarr Gunwarddebim – recording the Mirarr rock art. Area is in the Northern Territory technically within Kakadu National Park. Discussing Jabiluka protests 1990s-200s by Mirarr against mines.

11:36

Now starting - Recording rock art the Mirarr way (M. Marshall, S.May and G. Maclaren).

11:33

Discussion of practical application of RTI more generally for rock art e.g. extensive work by Cultural Heritage Imaging

11:30

Q&A: Were you able to capture RTIs during the day? Yes – done whenever the rock art sites were in shade where possible.

11:24

Martin Porr and Eleonora Gandolfi talking about UWA/ UoSouthampton collaboration on digital imaging of rock art in the Kimberley.

11:20

Connection collapsed for a while… Back on-line. My question related to what potential there was within their data structures for mediating access to material at a granular, contextual level e.g. only providing access to specific content within the panotour to specific groups. They have considered and implemented a broad data access structure that can respond to specific requirements. They also demonstrated the complexity of balancing different requirements. The question was prompted by our eMob project where we implemented very specific access controls as requested by communities, and subsequent discussions about the ways in which social medai sharing of images and other resources is subverting some access mediation.

10:57

They are using gigapixel imagery and 3d printing, and also tools to create digital annotations in three dimensions. Discussed 3d prints as alternative means of providing access to the digital record produced.


Now discussing contextual access. Now showing Manwanna dataset published via PanoTour at http://paulbourke.net/exhibition/Wanmanna/virtualtour.swf

10:56

Potential of using legacy data for processing via photogrammetric methods to derive 3d. (Note: We are exploring this at present on our archive of 30,000 photographs from the Portus Project to see if we can improve search and also identify components of buildings further to enhance our 3d record of the site).

10:54

Potential of relighting of models to show detail – shown via an animation but obvious potential for interactive. (No mention of RTI at the moment. Lots of discussion of rock art recording potential of RTI at our workshop yesterday.)

10:51

Meshlab examples shown with photogrammetric capture. Now discussing 2D vs 3d methods, via example of sites form India. He refers to 2.5D here to mean only capturing 3d data on one side of an object. Cape Labert recording examples shown next.

Limitations: baked on shadows, moving objects, fine structures such as grass

10:48

Opening paper J. McDonald – State of the Art: advances in Australian archaeological research and communication:

Laser scanning – cost and portability are an issue. Also complexity of use of point cloud data by non-survey users, Also the issue of replicability of results. Some difficulty in access to texture and colour. Finally the sheer amount of material.

As a result they have focused on photographic methods.


#CAAPerth Day Two – opening and first keynote

March 26, 2013
by Graeme Earl

Day two at @CAAPerth started with an introduction to the conference by Gary Lock. He thanked in particular Arianna Traviglia who brought this week’s events to fruition. Thanks Arianna! Gary noted that c. 250 had made it to CAA this year – the 41st year CAA has run – with at least 100 from Australia, representing another increase in CAA#s audience. Gary also noted the Nick Ryan bursary which is for current students. It will be voted on electronically and announced a month after the conference. Next up was the VC of UWA Paul Johnson. He provided an excellent, informed introduction and noted that this was the first CAA in the southern hemisphere. He described new courses running in archaeology at UWA, and then went on to discuss the rock art heritage of Australia in general and Western Australia in particular e.g. Western Desert regions, the Pilbara and the Kimberly. There are papers discussing technological applications relating to the latter two at CAA this week. He concluded by emphasising the significance of inter- and multi-disciplinary research practice. He works between social science and history and sees this research at the boundaries as amongst the most exciting – where assumptions are continuously challenged by people from a new perspective but equal intellectual commitment.


Next up Professor Len Collardfrom UWA giving us all a Welcome to Country from the Noongar people. He noted that it was ironic that the welcome to country is in a foreign language and said that he also wanted to welcome us in the language of the conference. He then discussed the relationship between the people of this country and archaeological practice there. He discussed the relationship between the disciplines such as indigenous studies and archaeology getting closer together and the positive impact this is happening. He mentioned that people talk about rock art a lot and so he gave Gary Lock a piece of rock art as a welcome to the country. He finished by playing his didgeridoo. It was an amazing sound, made even more so by the intakes of breath that the microphone picked up throughout. Best opening to a CAA I can remember, in all respects.


Next up was Ian Johnson, president of CAA Australia. He emphasised Len Collard’s welcome given to the ‘family’ of CAA. He also announced the official launch of CAA Australia taking place this evening. He then introduced the first keynote.

The keynote featured @ekansa Eric Kansa talking about http://opencontext.org/ and scholar communication.

He describes himself as an alt-ac – alternative academic, and noted the breadth and depth of activities in broad scale, evolving academic practice. Change has come and it is rapid, moving form a 19th C publication paradigm and moving to a much more data intensive paradigm, that also better reflects our current values. He noted that the web was itself born from the needs of scholarly communication, and also the long history of such motivations.

Eric then discussed ORBIS, and its invisibility in terms of academic credit. What do we consider to be ‘important’ and credit worthy academic contributions. Cue slide showing Austin Powers. Ne noted encourgaement to publish in the journal of evil (or was that medieval?) studies by Dr Evil :-) Next up “My Precious Data” and a slide of Gollem from Lord of the Rings. Here Eric discussed pioneering work of ADS in terms of looking after research data in the long term. Next a segue from Lord of the Rings to Ian Hodder and reading the past – the emphasis on scholarship building on rereading. Conventional scholarship does not well support such rereading, and in particular the separation between the data and the synthesis. We need theoretical understanding of value of data to be much more embedded in archaeological training. Such sharing and publciaiton of data inevitably leads on to thoughts of intellectual property. Eric discussed NAGRPA and (missing acronym) project exploring intellectual property and indigenous people’s rights. Eric then discussed Elsevier and the sense in which large scale publishing centralises, and consolidates scholarly practice – including in archaeology. And then wikipedia going dark against SOPA. Here I was reminded of the amazing seminar by @generalising last week.

Eric noted that libraries are in a sense ‘renting’ scholarly knowledge as a consequence of centralised publication practice. Then he discussed Aaron Swartz and the JSTOR case, and pay walls in general. Reminded of ongoing twitter and blog discussions mediated by @TarenSK If you do not have a university affiliation what do you do? You borrow a friend’s login or are sent a paper by email. But these are impossible legally in many cases. They also stifle scholarship both within and beyond the academy. What are the equity, legal and preservation issues of commodification of the past? Universities largely cannot afford ot pay for scholarly communications under the current model – he supported this with reference to Berkeley demonstrations last year. Even Harvard university noted they could not afford escalating scholarly communications costs. On a positive note he stressed the growth of alternative modes of scholary communications. He also talked about the work of Bethany Nowviskie and alt-ac. He discussed open data as an example of part fo this alternative academic revolution.

Eric then mentioned the Finch report and also his paper in Mark Lake’s World Archaeology special addition on Open Access and Archaeology. (Note: interesting twitter discussion around the irony of this being in a closed journal – mentioned also by Eric in the keynote- during #caauk2012 hosted by @lparchaeology .) He also noted how the USA is also now committing to open access to publically funded research data, and projects supporting this. (Note: our own @JISCDataPool project at University of Southampton has some relevance to this). He concluded by showing examples from open context such as Kenan Tepe, work on data citation, and then a round up showing what is next. Work with the Encyclopedia of Life including data from Catalhoyuk from 34 zooarchaeologists. More work is needed in modellign research methods in ways that are better than spreadsheets, and ways that support synthetic data research. If we elevate data to a first class citizen it is motivation for better tools. Hence need for FAIMS and Heurist. A fabulous start to @CAA2013Perth #caaperth

Related tweets via #caaperth:


#ArchCRG

Archives